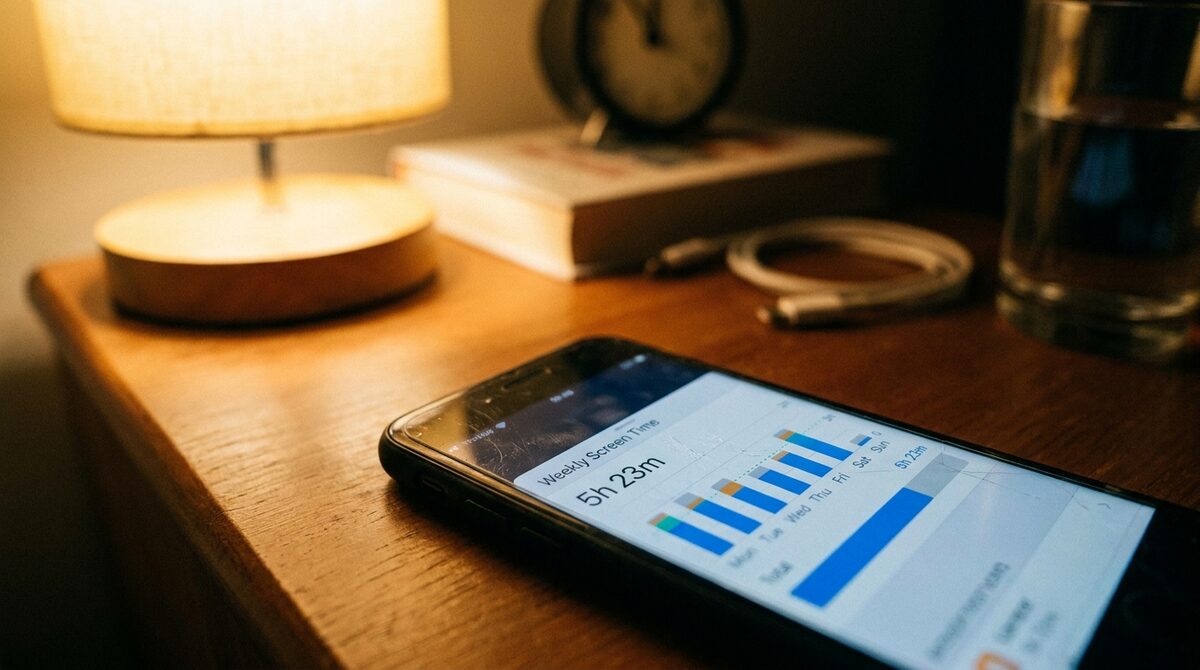
The average adult in 2026 spends approximately 6 hours and 57 minutes per day looking at a screen — a figure that has climbed steadily since 2020, according to data aggregated by DataReportal. Yet when surveyed, most adults estimate their own screen time at roughly half that amount.
That gap between perception and reality is not a minor rounding error. It represents thousands of hours per year that go unaccounted for, unexamined, and — for many people — entirely unconsidered. Passive screen time tracking, the act of recording usage data without making any deliberate effort to reduce it, exposes this gap with clinical precision.
What follows is a structured examination of what 30 days of unaltered screen time data actually reveals — myth by myth, number by number. These findings apply whether tracking takes place on a flagship smartphone in London or an entry-level Android device in Lagos. The behavioral patterns are remarkably consistent across device types and geographies.
Myth 1: Screen Time Is Mostly Productive
A common defense of high screen time figures is that much of the usage is work-related — emails, documents, video calls, research. The data from passive tracking tools does not support this narrative for most users.
When app-category breakdowns are examined across a 30-day window, social media, short-form video, and messaging apps consistently account for 55 to 70 percent of total screen time for non-professional users. Productivity applications — including email clients, document editors, and calendar tools — typically represent less than 20 percent of the total.
What the Category Breakdown Actually Shows
Tools such as Apple's Screen Time (iOS), Digital Wellbeing (Android), and third-party applications like RescueTime and Opal provide per-application and per-category usage logs. Over a 30-day baseline period, patterns that emerge include:
- Short-form video platforms (including TikTok, Instagram Reels, and YouTube Shorts) account for the largest single block of daily screen time in users under 45
- Messaging applications generate the highest number of individual session opens — often 40 to 80 discrete sessions per day — even when each session lasts under two minutes
- Browser usage splits roughly 60/40 between entertainment and information content, contrary to users' self-reported estimates of 80 percent informational browsing
"People do not lie about their screen time intentionally. They genuinely do not register micro-sessions — a 90-second Instagram check, a two-minute news scroll. But those micro-sessions add up to hours." — Dr. Amy Orben, behavioral scientist at the MRC Cognition and Brain Sciences Unit, University of Cambridge
The productive-use myth is particularly persistent because work and leisure usage often occur on the same device, making mental categorization unreliable. Passive tracking removes the need for memory-based categorization entirely.
Myth 2: Weekends Provide Natural Digital Rest
Many users assume their weekday screen time is elevated by occupational necessity, and that weekends offer a natural corrective. Thirty days of passive data consistently disproves this assumption.
Weekend screen time exceeds weekday screen time in approximately 68 percent of tracked users, according to usage data compiled by the app management platform One Sec in 2025. The structure of the workweek — meetings, deadlines, in-person obligations — imposes natural interruptions on device usage. Weekends remove those interruptions.
The Saturday Morning Effect
One of the more striking patterns in 30-day passive datasets is what researchers informally call the Saturday morning effect. Between 7:00 AM and 11:00 AM on Saturday, screen time spikes significantly — often recording the highest two-hour usage block of the entire week.
Without a commute, a morning meeting, or school drop-off to interrupt device use, the first waking hours on Saturday become extended scrolling sessions. Users who track this pattern often report genuine surprise, having assumed their weekend mornings were slower and more intentional than their weekday equivalents.
Myth 3: Awareness Alone Will Prompt Change
The passive tracking experiment — observing without intervening — directly tests a belief that underlies most digital wellness messaging: that seeing the numbers will naturally motivate users to change their behavior. The evidence suggests this belief is largely incorrect.
Studies examining the effect of screen time notifications on actual usage reduction find that fewer than 30 percent of users make measurable behavioral changes after seeing their weekly Screen Time reports. The majority acknowledge the data, experience a moment of discomfort, and continue at the same pace within 24 to 48 hours.
The Habituation Problem
This is not a failure of willpower. It is a function of habituation — the neurological process by which repeated stimuli become progressively less salient. Screen time notifications follow this pattern precisely. Initial exposure to a high weekly number triggers a stress response. By the third or fourth week of seeing similar numbers, the same notification generates almost no measurable emotional or behavioral response.
Research from the Oxford Internet Institute confirms that passive awareness, without structured intervention, does not produce sustained usage reduction. The data must be paired with deliberate friction — app timers, grayscale mode, notification batching — to generate durable behavioral shifts.
"Awareness is necessary but not sufficient. Knowing you spend four hours a day on social media does not automatically generate the motivation or the environmental structure needed to spend two hours instead." — Dr. Daria Kuss, Professor of Psychology, Nottingham Trent University
Myth 4: High Screen Time Is a Young Person's Problem
Media coverage of excessive device use skews heavily toward adolescents and young adults. This framing has allowed adults over 40 to largely exempt themselves from the conversation — and from tracking their own usage.
The 30-day passive tracking picture does not support this exemption. Adults aged 35 to 54 show average daily screen time figures of 6.4 hours, according to 2025 Nielsen data — a figure that is statistically comparable to users aged 18 to 34, who average 7.0 hours. The gap is narrower than popular perception suggests.
Where the Time Goes Differently
The application categories differ by age group, but total time does not. Younger users concentrate their screen time in short-form video and social platforms. Users over 40 distribute their usage more evenly across news applications, streaming services, messaging platforms, and social media — but the cumulative total remains high.
In markets across South and Southeast Asia, where smartphone adoption among adults over 40 accelerated significantly between 2020 and 2024, passive tracking data shows even more compressed generational differences. The behavioral patterns associated with heavy screen use — fragmented attention, late-night device use, compulsive checking — are not demographically bounded.
Myth 5: The Problem Is Total Time, Not Timing
Much of the screen time conversation focuses on raw daily totals. The 30-day passive tracking picture suggests that timing may matter as much as — or more than — total volume.
Bedtime device use is the single most consistently documented correlate of poor sleep quality in screen time research. A 2025 meta-analysis published in Sleep Medicine Reviews examined 67 studies involving more than 150,000 participants and found that device use in the 60 minutes before sleep was associated with a 35 percent increase in sleep onset latency — the time required to fall asleep — regardless of total daily screen time.
The Pre-Sleep Usage Pattern
Thirty-day passive data almost universally captures a pre-sleep usage spike. Between 9:30 PM and 11:30 PM, device activity rises significantly in most user profiles. This period is dominated by passive consumption — scrolling, streaming, reading — rather than active communication or productivity tasks.
The irony is measurable: users who report feeling fatigued and sleep-deprived frequently show the highest concentrations of screen time in the exact window that sleep research identifies as most disruptive to sleep architecture. The behavior that users turn to when exhausted is physiologically reinforcing the exhaustion itself.
Actionable Adjustments That Address Timing
- Enable scheduled downtime features on iOS and Android to automatically restrict non-essential applications after a designated evening hour
- Use grayscale mode as a passive deterrent during evening hours — color desaturation reduces the visual reward signal associated with social and entertainment applications
- Move device charging stations out of the bedroom — a structural change that eliminates the availability of devices during pre-sleep and early morning periods without requiring ongoing willpower
- Set application-specific session timers for the three highest-usage applications identified in week one of tracking — these are statistically the most effective targets for time reduction
- Review weekly screen time reports on Monday mornings rather than Sunday evenings, to avoid the decision fatigue that undermines resolution-setting at the end of a weekend
How to Run a Meaningful 30-Day Tracking Period
The value of passive tracking lies in the integrity of the baseline. Modifying behavior during the observation period contaminates the data and produces numbers that feel better but inform less.
Recommended Tools by Platform
- iOS users: Screen Time (Settings > Screen Time) provides per-application data, category breakdowns, and weekly comparison reports. No download required.
- Android users: Digital Wellbeing (Settings > Digital Wellbeing and Parental Controls) offers equivalent functionality, including app timers and Focus Mode scheduling.
- Cross-platform and desktop users: RescueTime provides background tracking across Windows, macOS, Android, and Chrome, categorizing activity automatically and generating weekly productivity scores.
- Users seeking structured analysis: Opal (iOS) and ActionDash (Android) provide more granular session-level data and visual trend reporting suited to month-over-month comparison.
The 30-day window is not arbitrary. Weekly patterns require four full cycles to average out anomalies — a vacation week, a high-stress work period, an illness. A single week of data produces misleading conclusions. Four weeks produces a behaviorally representative baseline.
What to Record Beyond App Time
Pure screen time data gains analytical power when cross-referenced with subjective experience logs. Recording sleep quality, energy levels, concentration ratings, and mood on a simple 1-to-5 scale each evening takes less than 90 seconds and produces correlation data that transforms abstract numbers into personally meaningful insights.
When a user can observe that their five highest screen time days correspond to their five lowest energy scores across a 30-day period, the motivational calculus shifts from abstract health guidance to personal evidence. That shift is what passive tracking, done properly, is designed to produce.
The numbers that emerge from 30 days of passive screen time tracking do not require embellishment. They are, for most users, sufficiently startling on their own terms. The global conversation about digital wellness in 2026 is increasingly moving away from moral arguments about device use and toward data-driven behavioral design — systems that make the healthier choice the easier choice.
Understanding the baseline is where that work begins. Before any timer is set, any application deleted, or any digital detox attempted, the most evidence-grounded step available to any device user is simply to observe — accurately, completely, and without interference — what is already happening every day on the screens they carry.